
Ethereum price has slipped to about $1,875 after sellers rejected its latest move above $1,900, leaving the $1,850 support zone and nearby liquidation clusters in focus.
Summary
- Ethereum price traded near $1,875 after failing to hold above the psychological $1,900 level.
- Daily RSI fell to 49.72, while ETH remained below its 20-day and 50-day averages.
- Liquidation liquidity is concentrated near $1,925–$1,950, with downside clusters around $1,840–$1,860.
- U.S. spot Ethereum ETFs attracted $245 million during their fifth consecutive week of inflows.
Ethereum price loses momentum below $1,900
According to data from crypto.news, Ethereum (ETH) price traded at $1,874.90 on Aug. 14 after moving between an intraday low of $1,869.32 and a high of $1,891.30. The asset was down 0.6% on the daily candle at the time the chart was captured.
The latest decline extended ETH’s failure to hold the $1,900 level, which has repeatedly attracted selling during August. Price briefly traded above $1,920 earlier in the week before sliding back into the $1,870–$1,890 area.
Profit-taking near $1,900 has kept Ethereum inside a narrow range rather than producing a clean trend. Buyers have defended declines toward $1,850, but each rebound has struggled as it approached $1,920.
The 4-hour chart shows the same loss of momentum. ETH recovered from its late-June low around $1,550 and reached almost $1,980 in late July, but it has since recorded several unsuccessful attempts to establish support above $1,900.
Short-term sellers regained control after the most recent push toward $1,920 faded. Ethereum then formed lower intraday highs and returned to $1,875, putting the lower edge of its August range under pressure.
Liquidation levels could pull ETH in either direction
CoinGlass’ one-week liquidation heatmap shows several large liquidity concentrations above Ethereum’s current price. The strongest visible band sits around $1,940–$1,950, with another notable cluster close to $1,925.
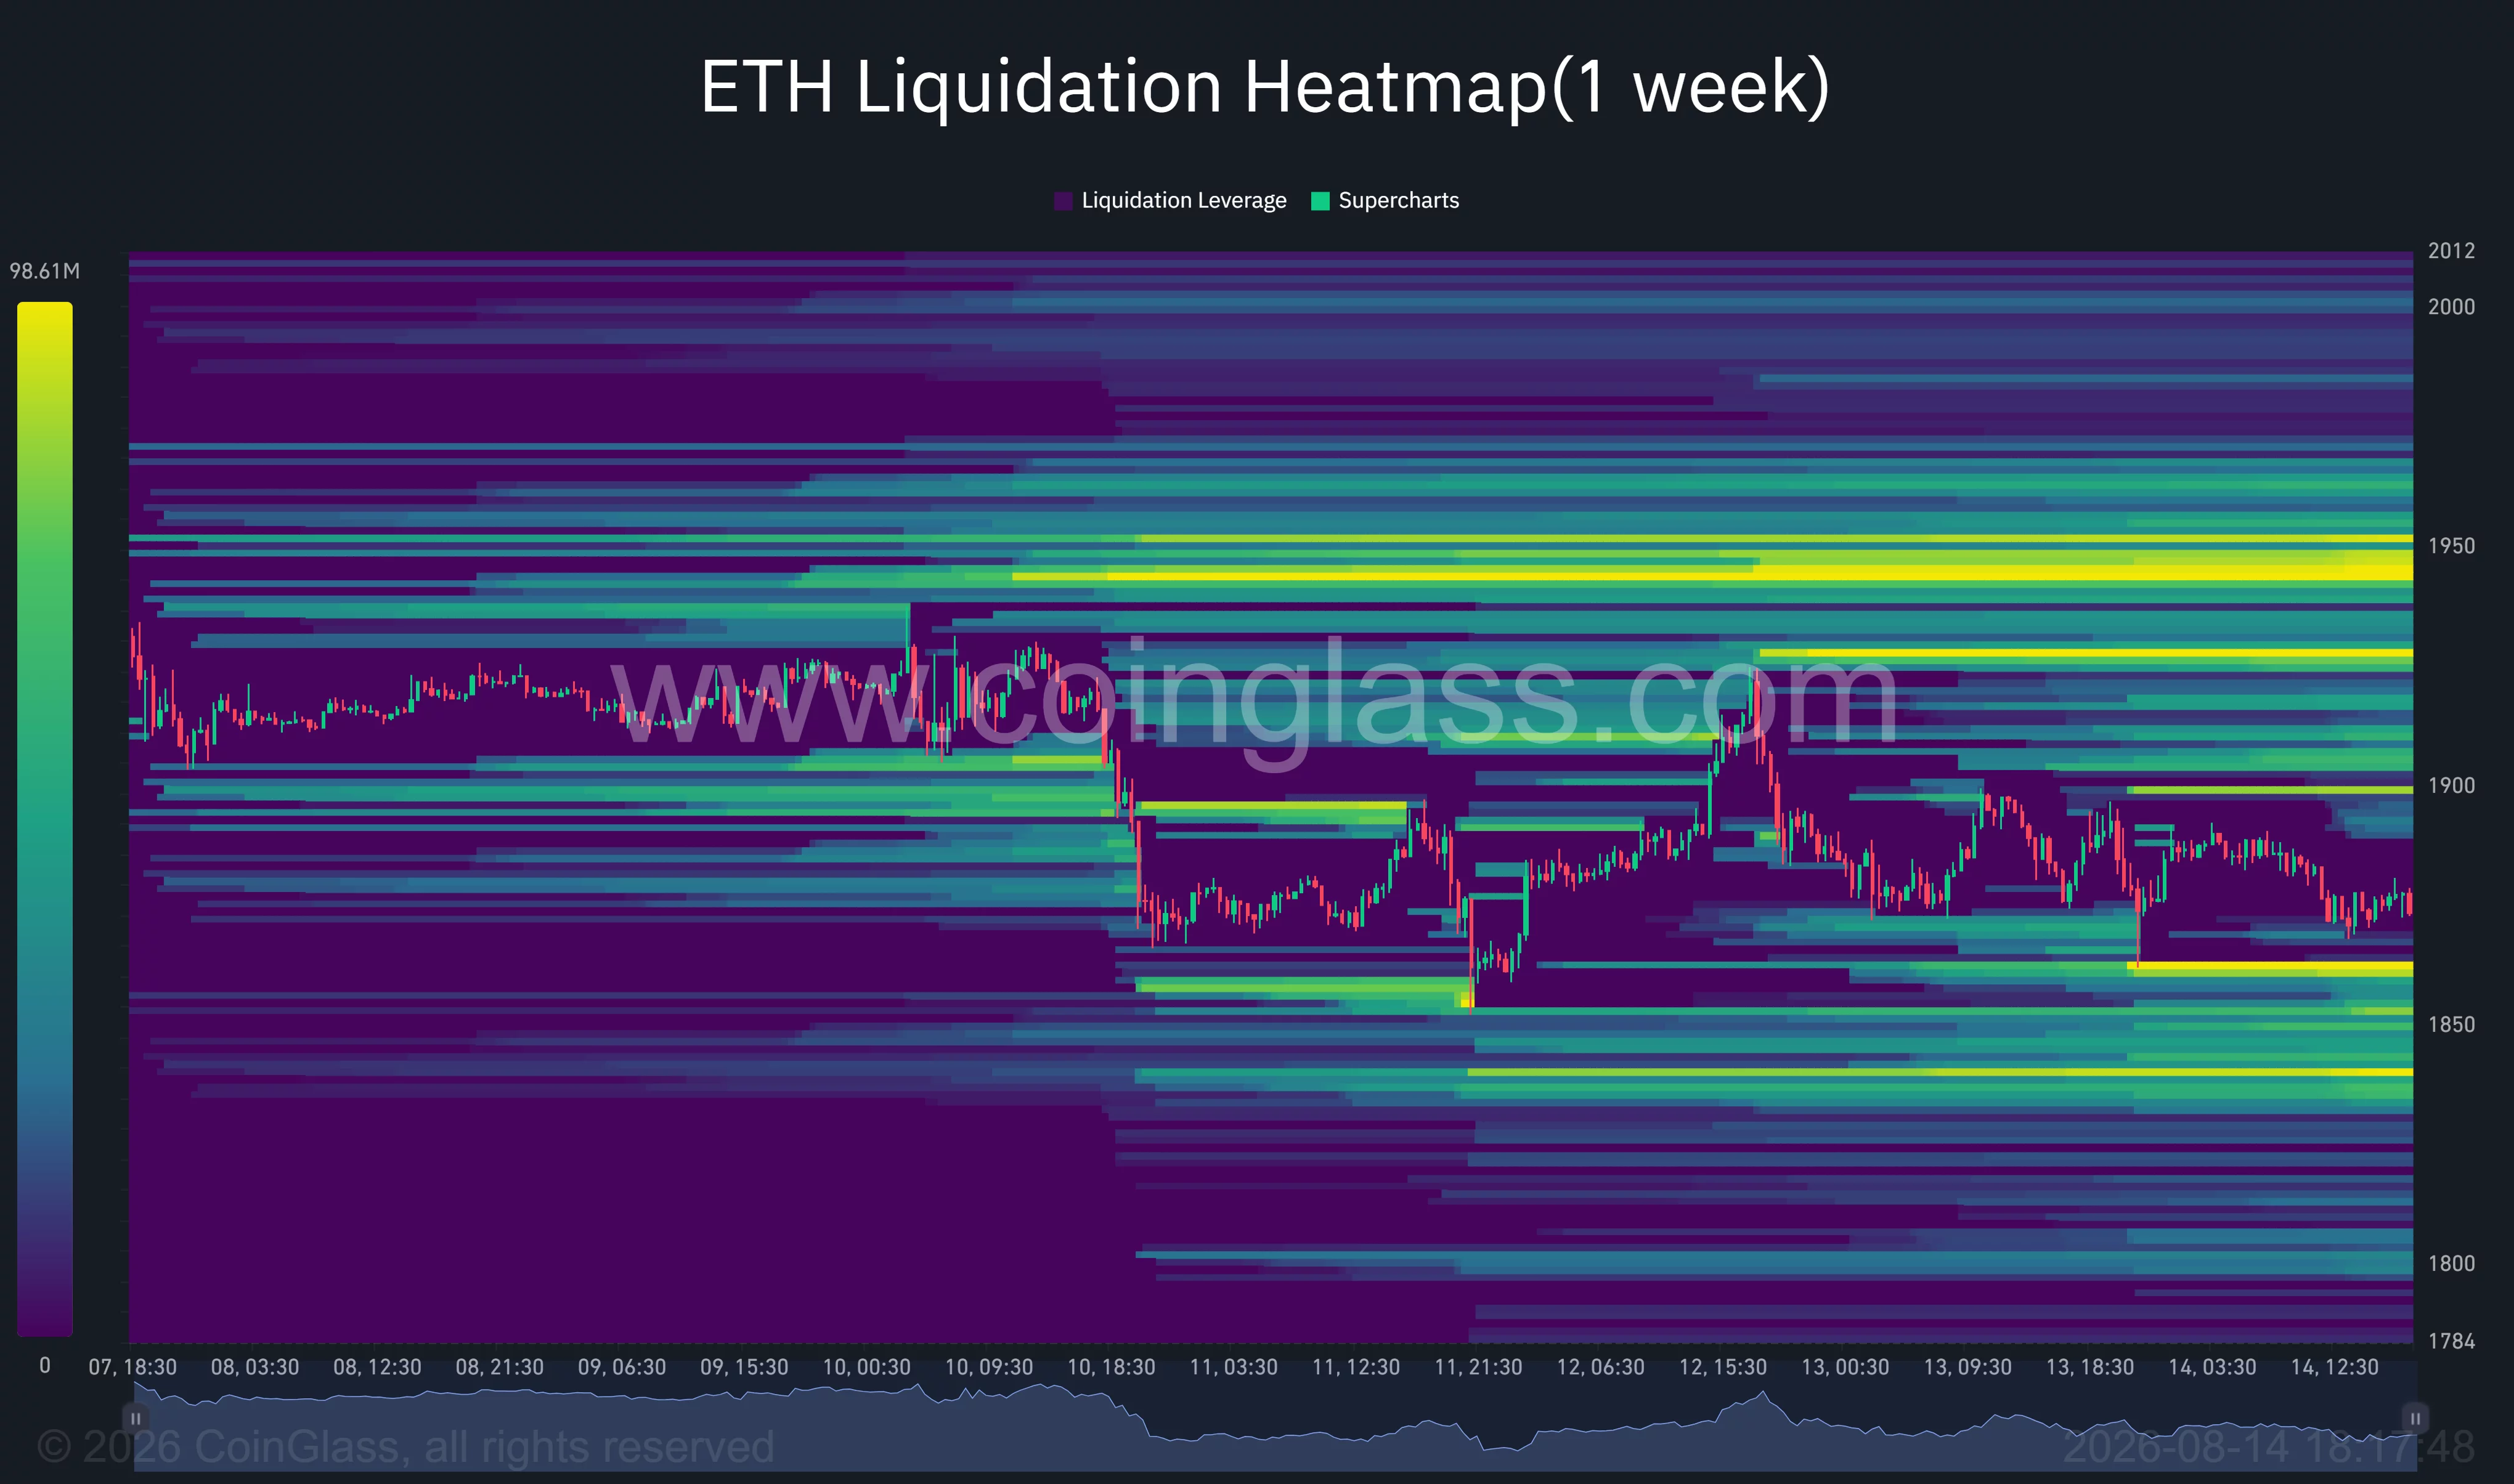
Leveraged short positions may become vulnerable if Ethereum reclaims $1,900 and continues toward those areas. A move into the clusters could force short sellers to close their positions, adding market purchases and accelerating the rebound.
ETH must first break the immediate resistance around $1,890–$1,900. Failure there would leave the upper liquidity bands untouched and keep the market exposed to another test of support.
Below the current price, the heatmap shows active liquidity near $1,855–$1,860 and a larger band around $1,835–$1,845. Those areas could attract price if sellers push ETH decisively below $1,850.
The heatmap therefore places Ethereum between competing pools of leveraged positions. The closest downside concentration is within roughly $20 of the current price, while the largest upside cluster sits about $65–$75 higher.
A break below $1,850 could trigger long liquidations and carry ETH toward $1,840. Conversely, a close above $1,900 would open a path toward $1,925, followed by the more heavily concentrated $1,940–$1,950 zone.
Ethereum indicators remain mixed near key support
Ethereum’s daily chart presents a neutral-to-weak setup. The relative strength index stood at 49.72, below its signal average of 52.55 and slightly under the neutral 50 level.
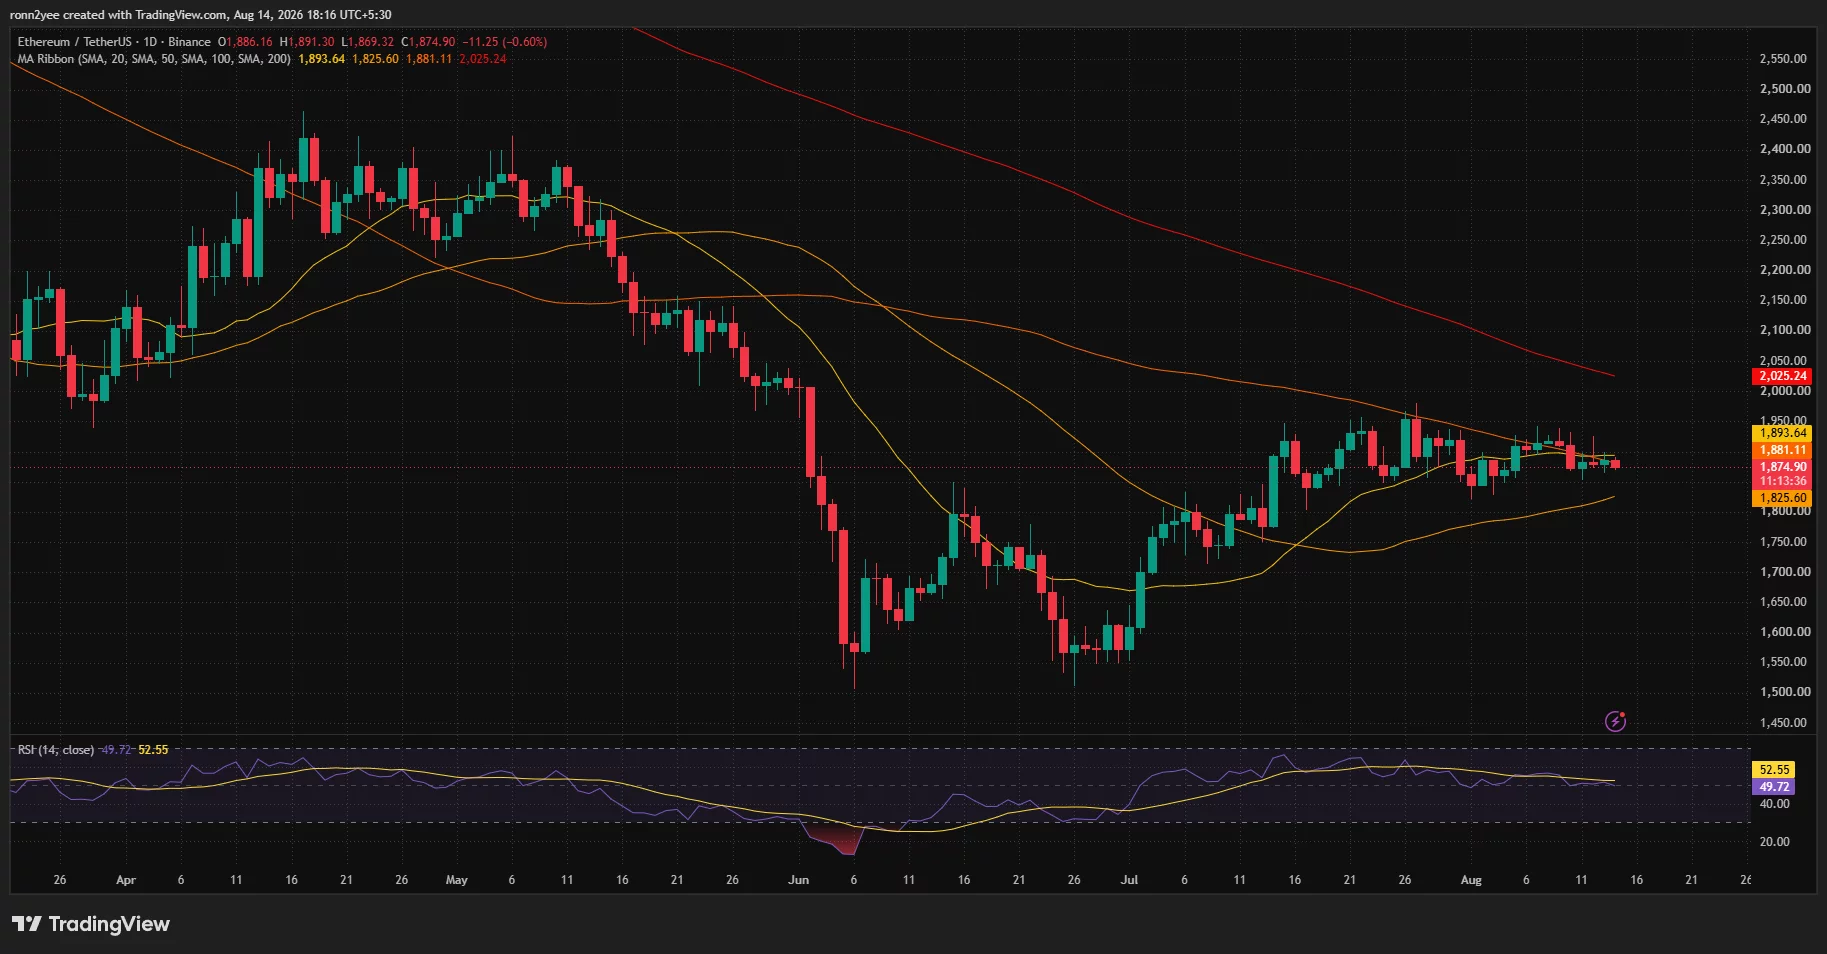
ETH also traded below its 20-day simple moving average at $1,881.11 and its 50-day average at $1,893.64. Both averages now form immediate resistance around the same area where recent rebounds have stalled.
The asset remains above its 100-day average at $1,825.60, leaving the medium-term recovery from June intact. Losing $1,850, however, would reduce the distance between price and the 100-day average and expose the $1,825–$1,840 region.
Long-term resistance is substantially higher. The 200-day moving average stood at $2,025.24, showing that Ethereum has not yet reversed the larger downtrend that began after its April and May highs above $2,300.
On the 4-hour chart, Aroon Up registered 64.29% compared with Aroon Down at 14.29%. The gap suggests the recent rebound structure has not fully disappeared, although the price action has yet to confirm renewed upside strength.
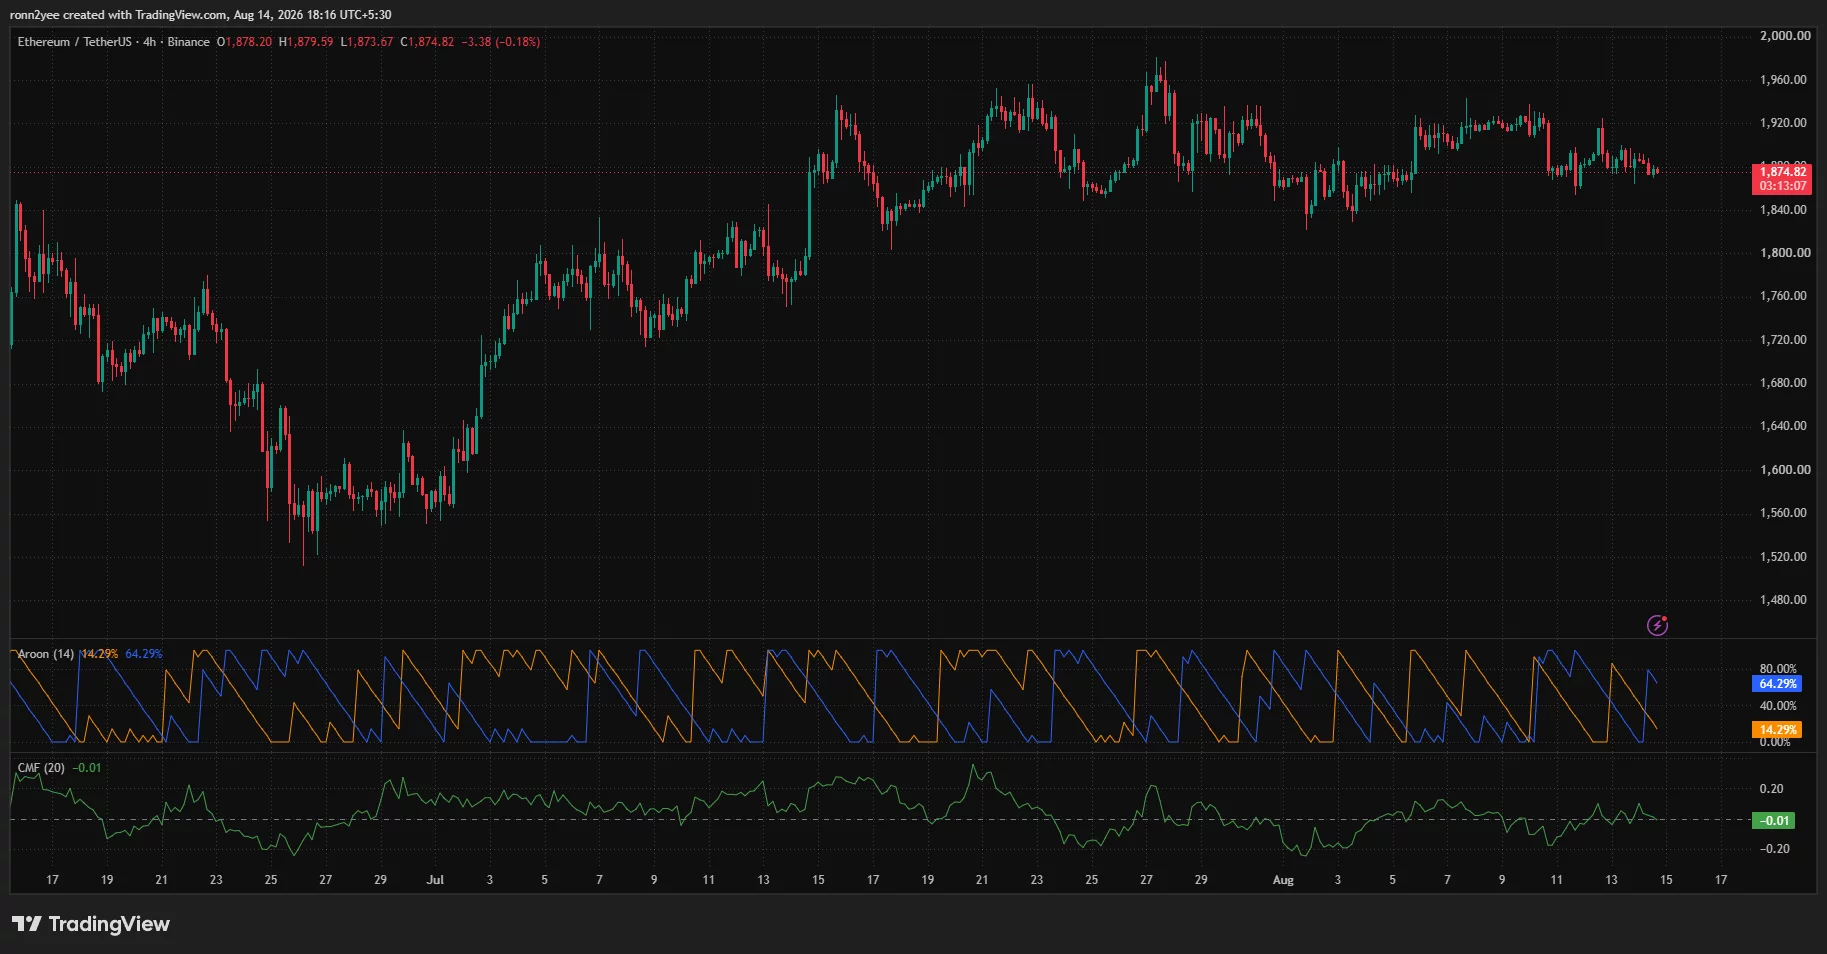
Chaikin Money Flow stood at minus 0.01, indicating that buying and selling pressure were almost balanced, with a slight advantage for sellers. The reading supports the view that Ethereum lacks the sustained inflows needed for a firm breakout.
Analysts identify $1,850 as Ethereum’s must-hold level
Crypto analyst Ted Pillows said Ethereum was still holding above its $1,850 support zone, describing it as a “must-hold level” if the asset is to preserve its recent gains.
His chart places the first upside barrier around $1,955, followed by $2,050 and $2,190. On the downside, a loss of $1,850 could expose approximately $1,700 before the larger support region around $1,550.
The analyst’s levels broadly match the daily chart, where the 100-day moving average sits near $1,826. A sustained break below both $1,850 and that average would weaken the recovery established since late June.
Meanwhile, MN Trading founder Michaël van de Poppe said Ethereum was gaining against Bitcoin and approaching the 0.03 level on the ETH/BTC pair. He expects a possible liquidity flush if Bitcoin sweeps lower, but said the relative trend remains clear as Bitcoin consolidates and altcoins perform more strongly.
Relative strength against Bitcoin does not remove Ethereum’s dollar-based resistance. ETH still needs to reclaim $1,900 and clear the dense $1,925–$1,950 liquidity area before its short-term structure turns more constructive.
U.S. ETF inflows offer support but have not forced a breakout
U.S. spot Ethereum exchange-traded funds recorded $245 million in net inflows during the Aug. 3–7 trading week, extending their positive run to five consecutive weeks, according to SoSoValue data.
BlackRock’s ETHA accounted for about $203 million of the weekly total, while Fidelity’s FETH attracted approximately $24.2 million. Grayscale’s ETHE recorded about $4.8 million in net outflows during the same period.
The sustained ETF demand provides U.S. investors with regulated exposure to Ethereum and shows that institutional accumulation has continued despite weak short-term price action. Still, $245 million in weekly inflows has not been enough to push ETH through the resistance between $1,900 and $1,950.
Macro conditions have offered mixed signals. U.S. equity funds attracted $2.58 billion in the week through Aug. 12 as softer labor data and stable inflation reduced expectations of a Federal Reserve rate increase.
Technology-focused funds nevertheless posted $4.62 billion in withdrawals during the period. The uneven risk appetite leaves Ethereum dependent on whether spot demand can absorb sales near $1,900 while leveraged traders remain concentrated on both sides of the current range.
Disclosure: This article does not represent investment advice. The content and materials featured on this page are for educational purposes only.