
Ethereum price held above $2,500 on Aug. 27 after strong US spot ETF inflows, improving global liquidity conditions, and a historic short squeeze supported its weekly breakout.
Summary
- Ethereum price gained about 7.8% from its Aug. 21 opening price to trade near $2,507.
- US spot Ethereum ETFs attracted $697.2 million during their strongest inflow week of 2026.
- The daily chart places ETH at the critical $2,500 resistance level, with $2,656 as the next upside target.
- Liquidation data show concentrated leverage around $2,550 above price and $2,415 below it.
Ethereum price holds its weekly breakout
According to data from crypto.news, Ethereum (ETH) price traded near $2,507 at the time of writing, up about 7.8% from its Aug. 21 opening price of $2,326. The token briefly reached a weekly high near $2,566 before settling into a narrow range around the psychological $2,500 level.
The move followed a sharp breakout from the $1,875–$1,950 range that had contained ETH for much of August. Buyers pushed the price above its February-to-May resistance area and have so far prevented a deeper return to the former range.
Ethereum’s daily chart shows the price trading almost exactly at the $2,500 Murrey Math resistance. Chaikin Money Flow stood at 0.24, remaining well above zero and showing that buying pressure continued to outweigh selling pressure.
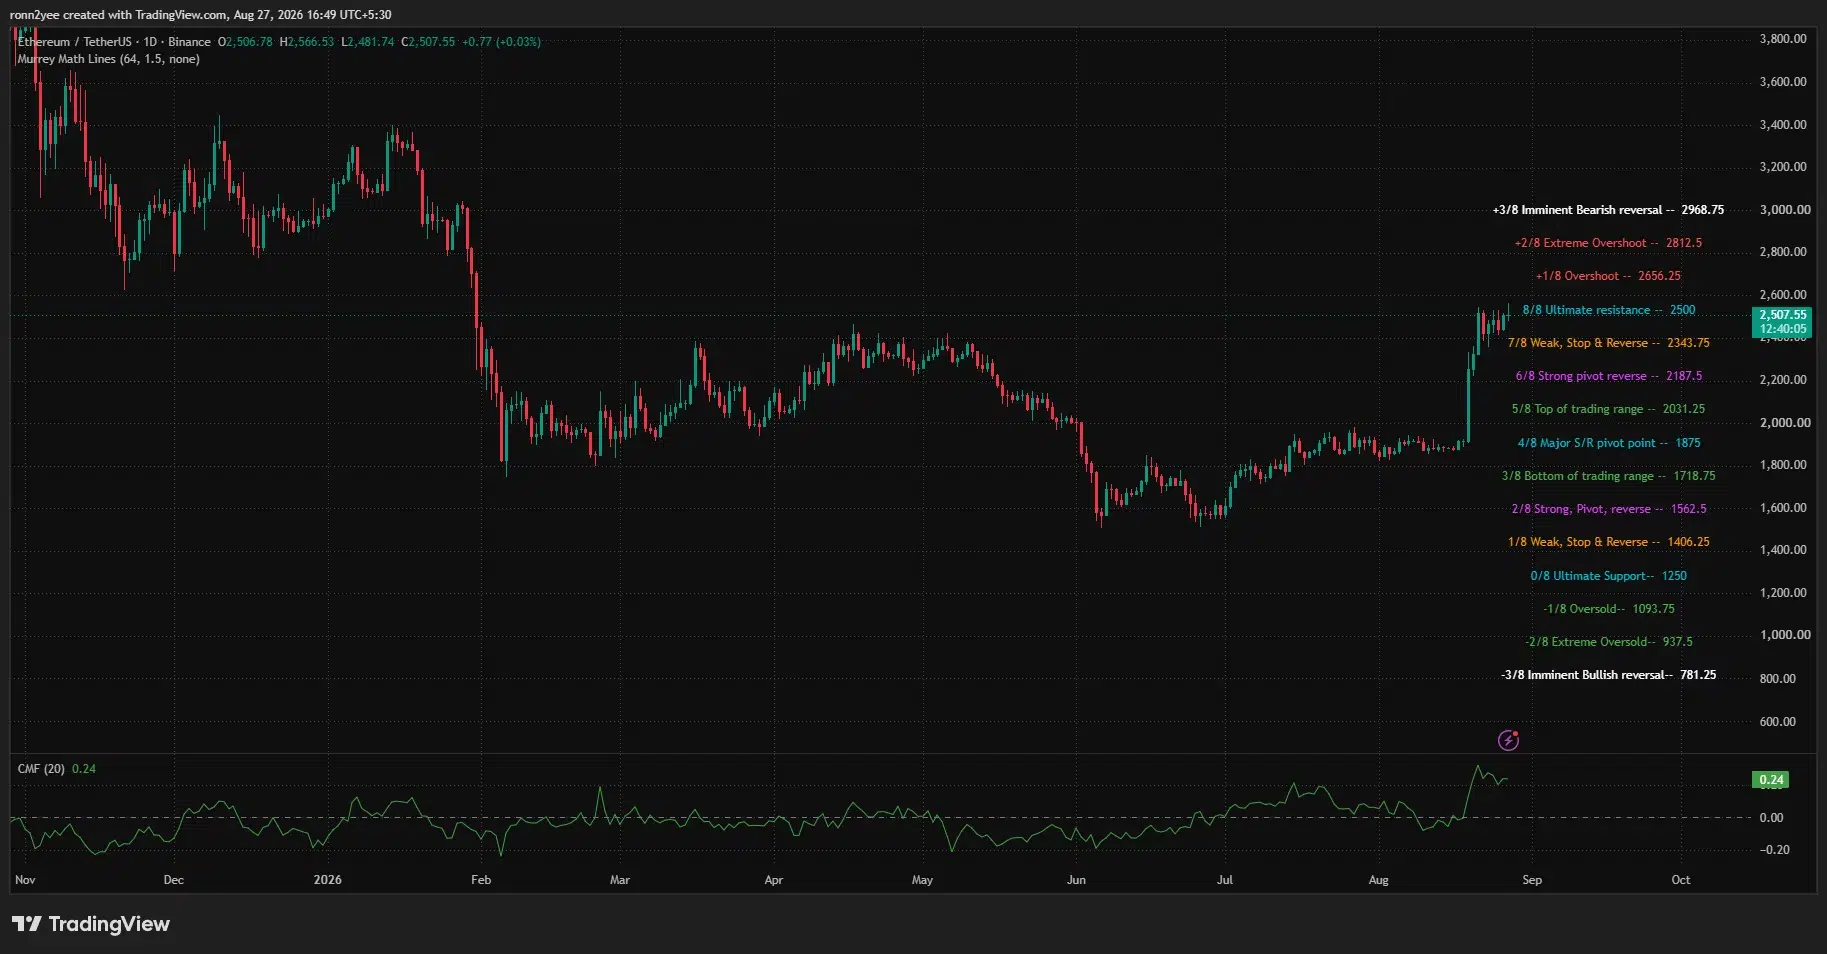
Holding above $2,500 would turn the former resistance into support and strengthen the case for another leg higher. A rejection, however, could leave the breakout vulnerable because ETH has moved more than 30% from its pre-rally consolidation zone without a major correction.
Why is Ethereum price up?
Ethereum’s rally began after the US Treasury announced that it would at least double the maximum size of its long-end liquidity-support bond buybacks from $2 billion to $4 billion per operation beginning Sept. 9. The increase covers nominal Treasury securities in the 10-to-20-year and 20-to-30-year sectors. The Treasury announced the change on Aug. 19.
Market participants treated the decision as supportive of liquidity-sensitive assets. Bond buybacks can improve trading conditions in older Treasury securities, while lower long-term yields generally make risk assets such as cryptocurrencies more attractive relative to fixed-income investments.
A record derivatives squeeze amplified the initial move. Nearly $3 billion in leveraged crypto positions were liquidated in 24 hours, with bearish positions accounting for about 92% of the total. Ethereum jumped roughly 18% during the event as short sellers were forced to close positions in a rising market. crypto.news reported that it was the largest concentrated short squeeze since November 2021.
US institutional demand then helped ETH retain those gains. Spot Ethereum exchange-traded funds recorded approximately $697.2 million in net inflows during the week ending Aug. 21, their strongest weekly performance of 2026. The inflows formed part of a combined $2.6 billion entering US-listed Bitcoin and Ethereum funds.
ETF demand provided a spot-market foundation after the liquidation-driven rally. It also helped offset isolated negative developments in decentralized finance, including the estimated $8.5 million loss connected to the Term Finance governance attack.
Ethereum faces a liquidity test at $2,550
The 4-hour chart shows ETH consolidating in the upper half of its Bollinger Bands. Price stood above the indicator’s $2,477 midpoint, while the upper and lower bands were positioned near $2,514 and $2,441.
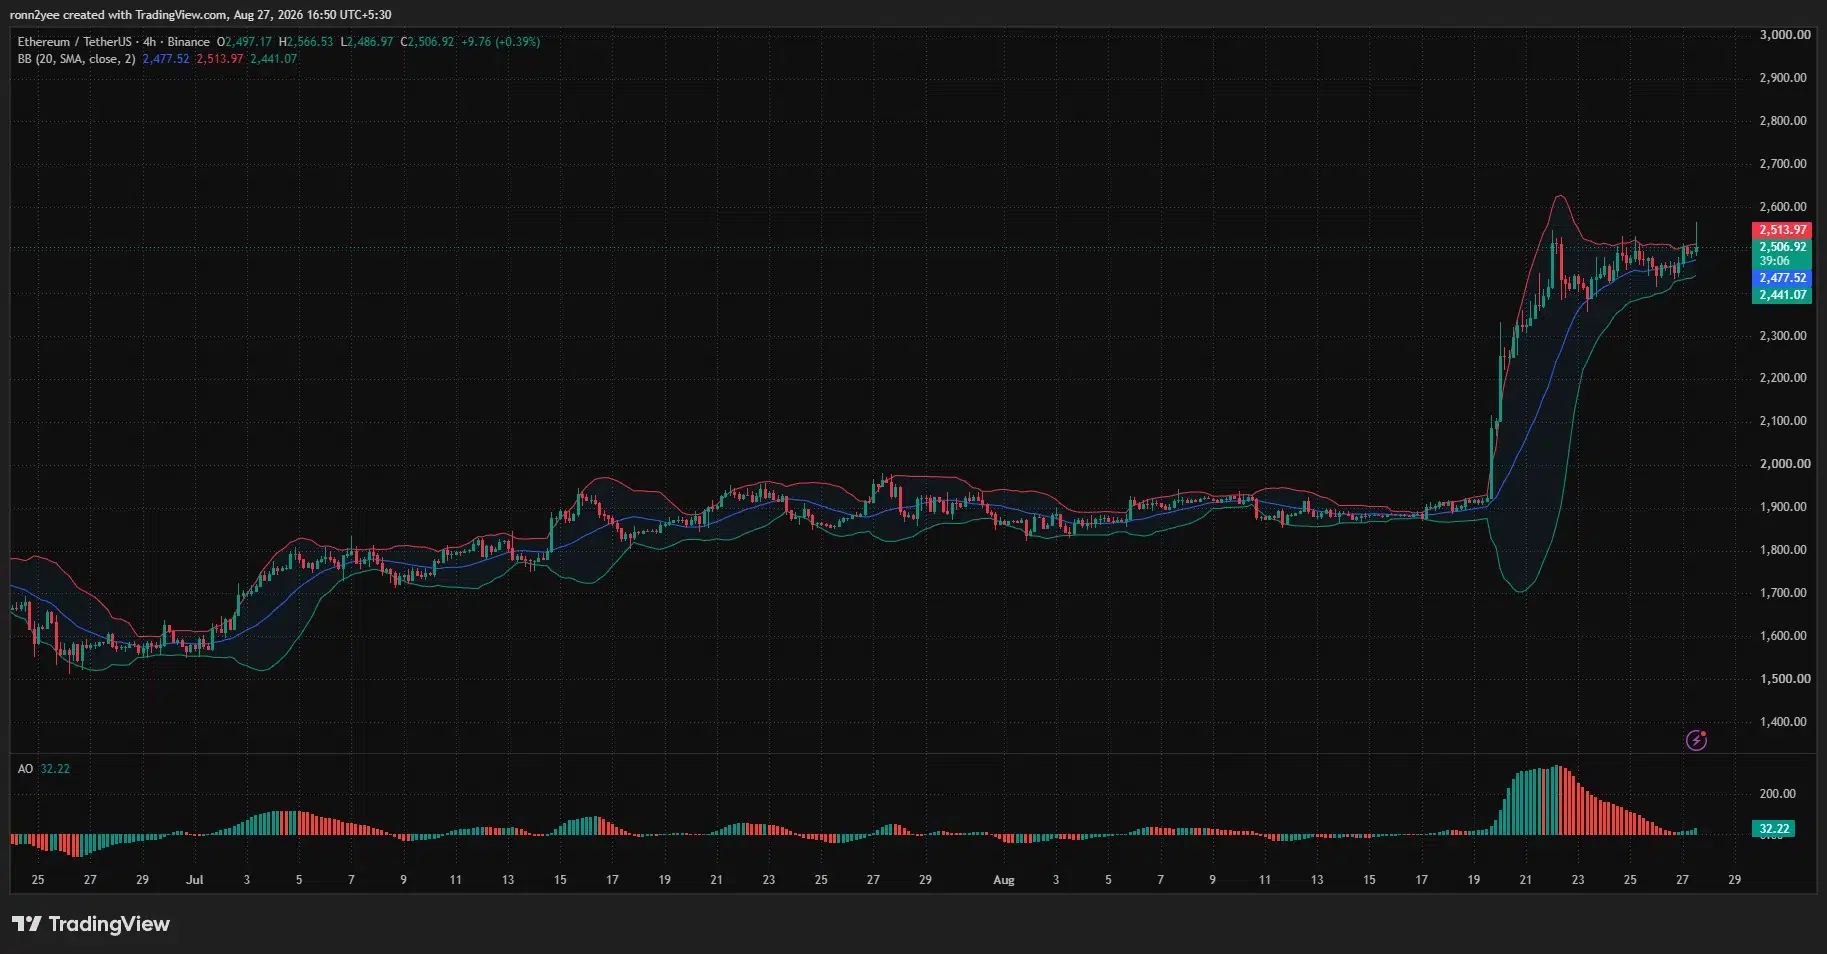
A 4-hour close above the upper band would indicate that buyers have regained short-term control. The Awesome Oscillator remained positive at 32.22 and had started printing green bars again, suggesting that momentum was attempting to recover after weakening during the consolidation.
The three-day CoinGlass liquidation heatmap identifies the largest nearby liquidity concentration around $2,545–$2,555. Price often moves toward areas containing dense leveraged positions, making that region the immediate target if ETH continues higher.
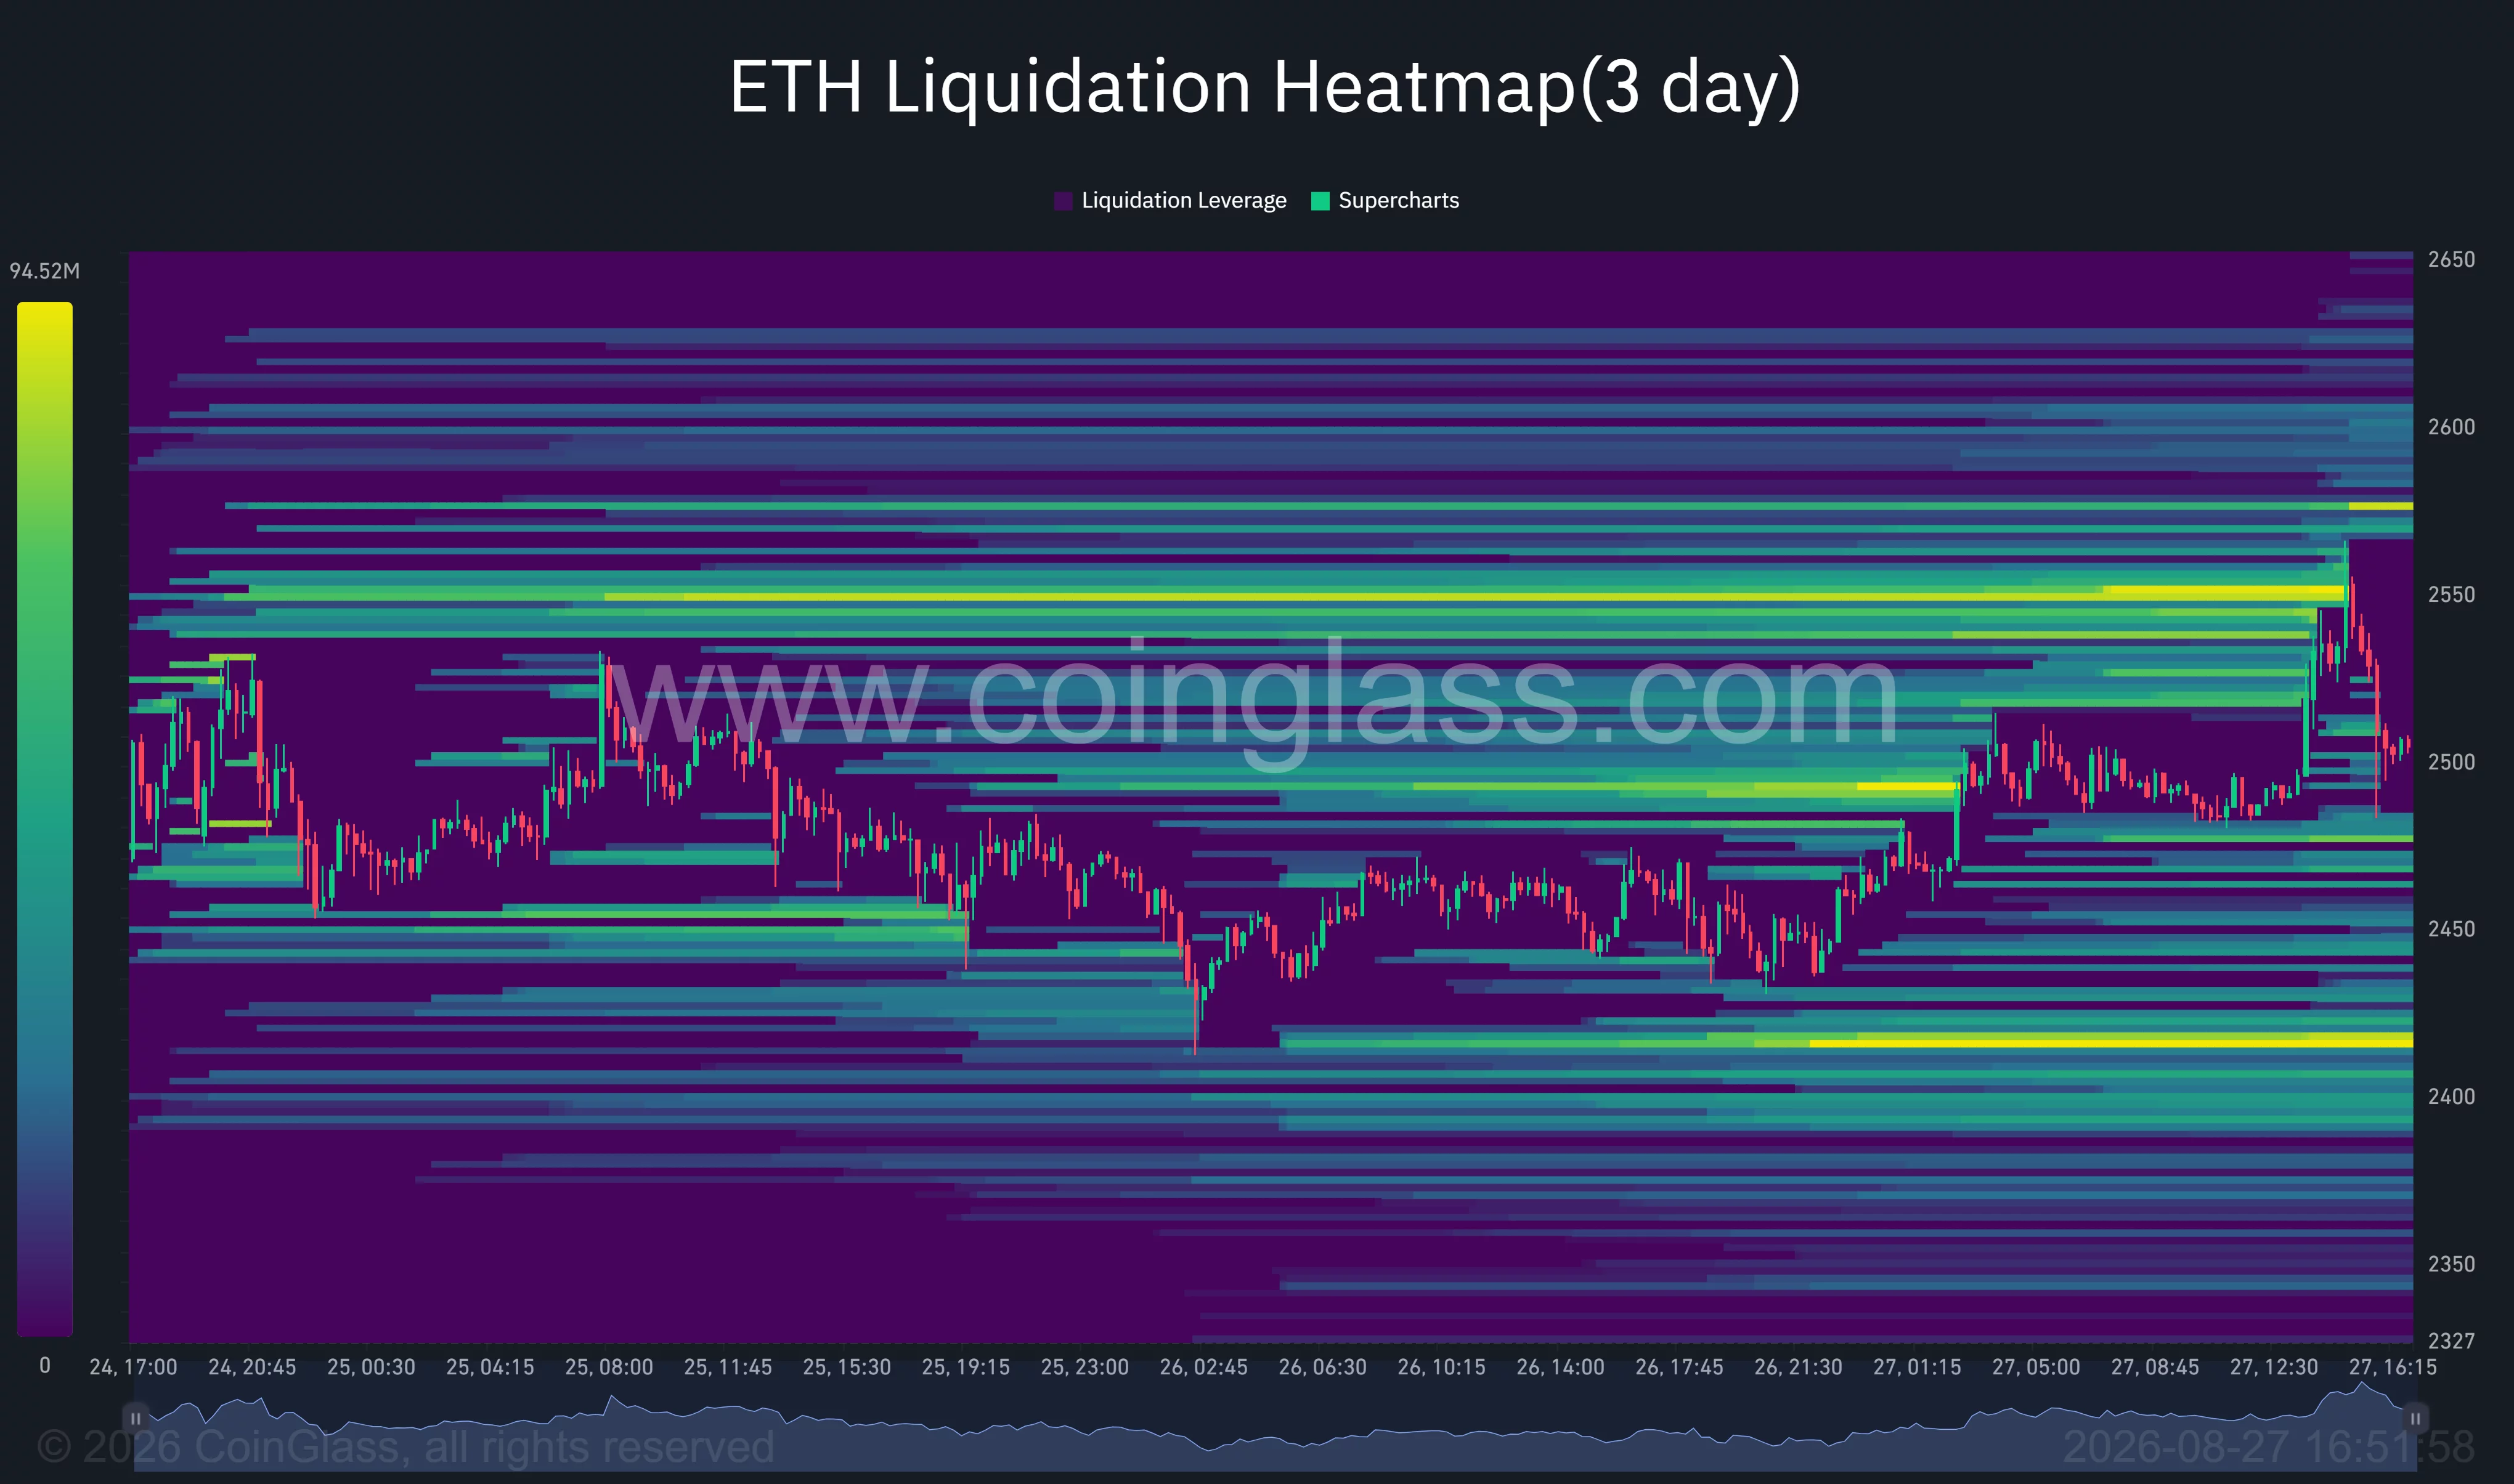
Clearing $2,550 could expose thinner liquidity between approximately $2,575 and $2,600. The daily chart identifies $2,656 as the next major technical target, followed by $2,812 if momentum expands.
Leverage also creates downside risk. The heatmap shows a large liquidation cluster near $2,410–$2,420, while the 4-hour Bollinger Band provides nearer support at $2,477 and $2,441. Losing those levels could pull ETH toward the larger liquidity pool below.
Broader daily support sits at $2,343, followed by the $2,187 pivot. A decline below $2,343 would place the latest breakout at risk and increase the chance of a return toward the previous trading range.
Analysts watch the weekly close above $2,550
Crypto trader Daan Crypto Trades said ETH was consolidating above its previous resistance but needed to extend the rally soon to avoid falling back below the breakout level.
“Otherwise you risk deviating back below the resistance and for this to turn into a big liquidity grab,” the analyst wrote.
The trader said bulls should push Ethereum to new local highs by the end of the week. Failure to do so could produce a rejection wick, weakening the apparent breakout.
Analyst Ted Pillows also identified $2,550 as Ethereum’s decisive resistance zone. According to his weekly chart, a close above that level could open a move toward $3,000. The chart places the first major support near $2,180 and a lower support area around $1,950.
The daily Murrey Math setup broadly supports that upside scenario. A confirmed break above $2,500 would place $2,656, $2,812, and $2,969 on the chart as successive targets. The first two levels represent overbought territory, meaning traders could take profits even if the broader trend remains positive.
Ethereum’s next move therefore depends on whether ETF-supported spot demand can carry the price through the $2,550 liquidity wall. A weekly close above it would confirm that buyers retained control after the short squeeze, while a drop through $2,441 would signal that the rally has entered a deeper retracement.
Disclosure: This article does not represent investment advice. The content and materials featured on this page are for educational purposes only.