
Explore
.cwp-coin-chart svg path {
stroke-width: 0.65 !important;
}
Price
Volume in 24h
<!–
?
–>
Price 7d
recent price action through in-depth Bitcoin technical analysis. This article dives into key Bitcoin chart patterns, support and resistance levels, and trading signals driving cryptocurrency market trend. With search interest peaking in late March 2025, we uncover what technical indicators like RSI, moving averages, and volume suggest about Bitcoin next move. Whether you’re a seasoned trader or crypto enthusiast, gain actionable insights into the forces shaping BTC price volatility and crypto trading signals.
$BTC supply hits 8 year low as demand from whales intensifies pic.twitter.com/Q8BiVK8K3M
— The Crypto Professor (@TheCryptoProfes) March 29, 2025
The Bitcoin supply is great to look at since the supply / demand dynamics apply for it as well. The more interest there is, the higher the price will grow. Just like the housing market in the last few years. Please refer to last week’s article here for more context.
Bitcoin Technical Analysis for End of March

(BTCUSDT)
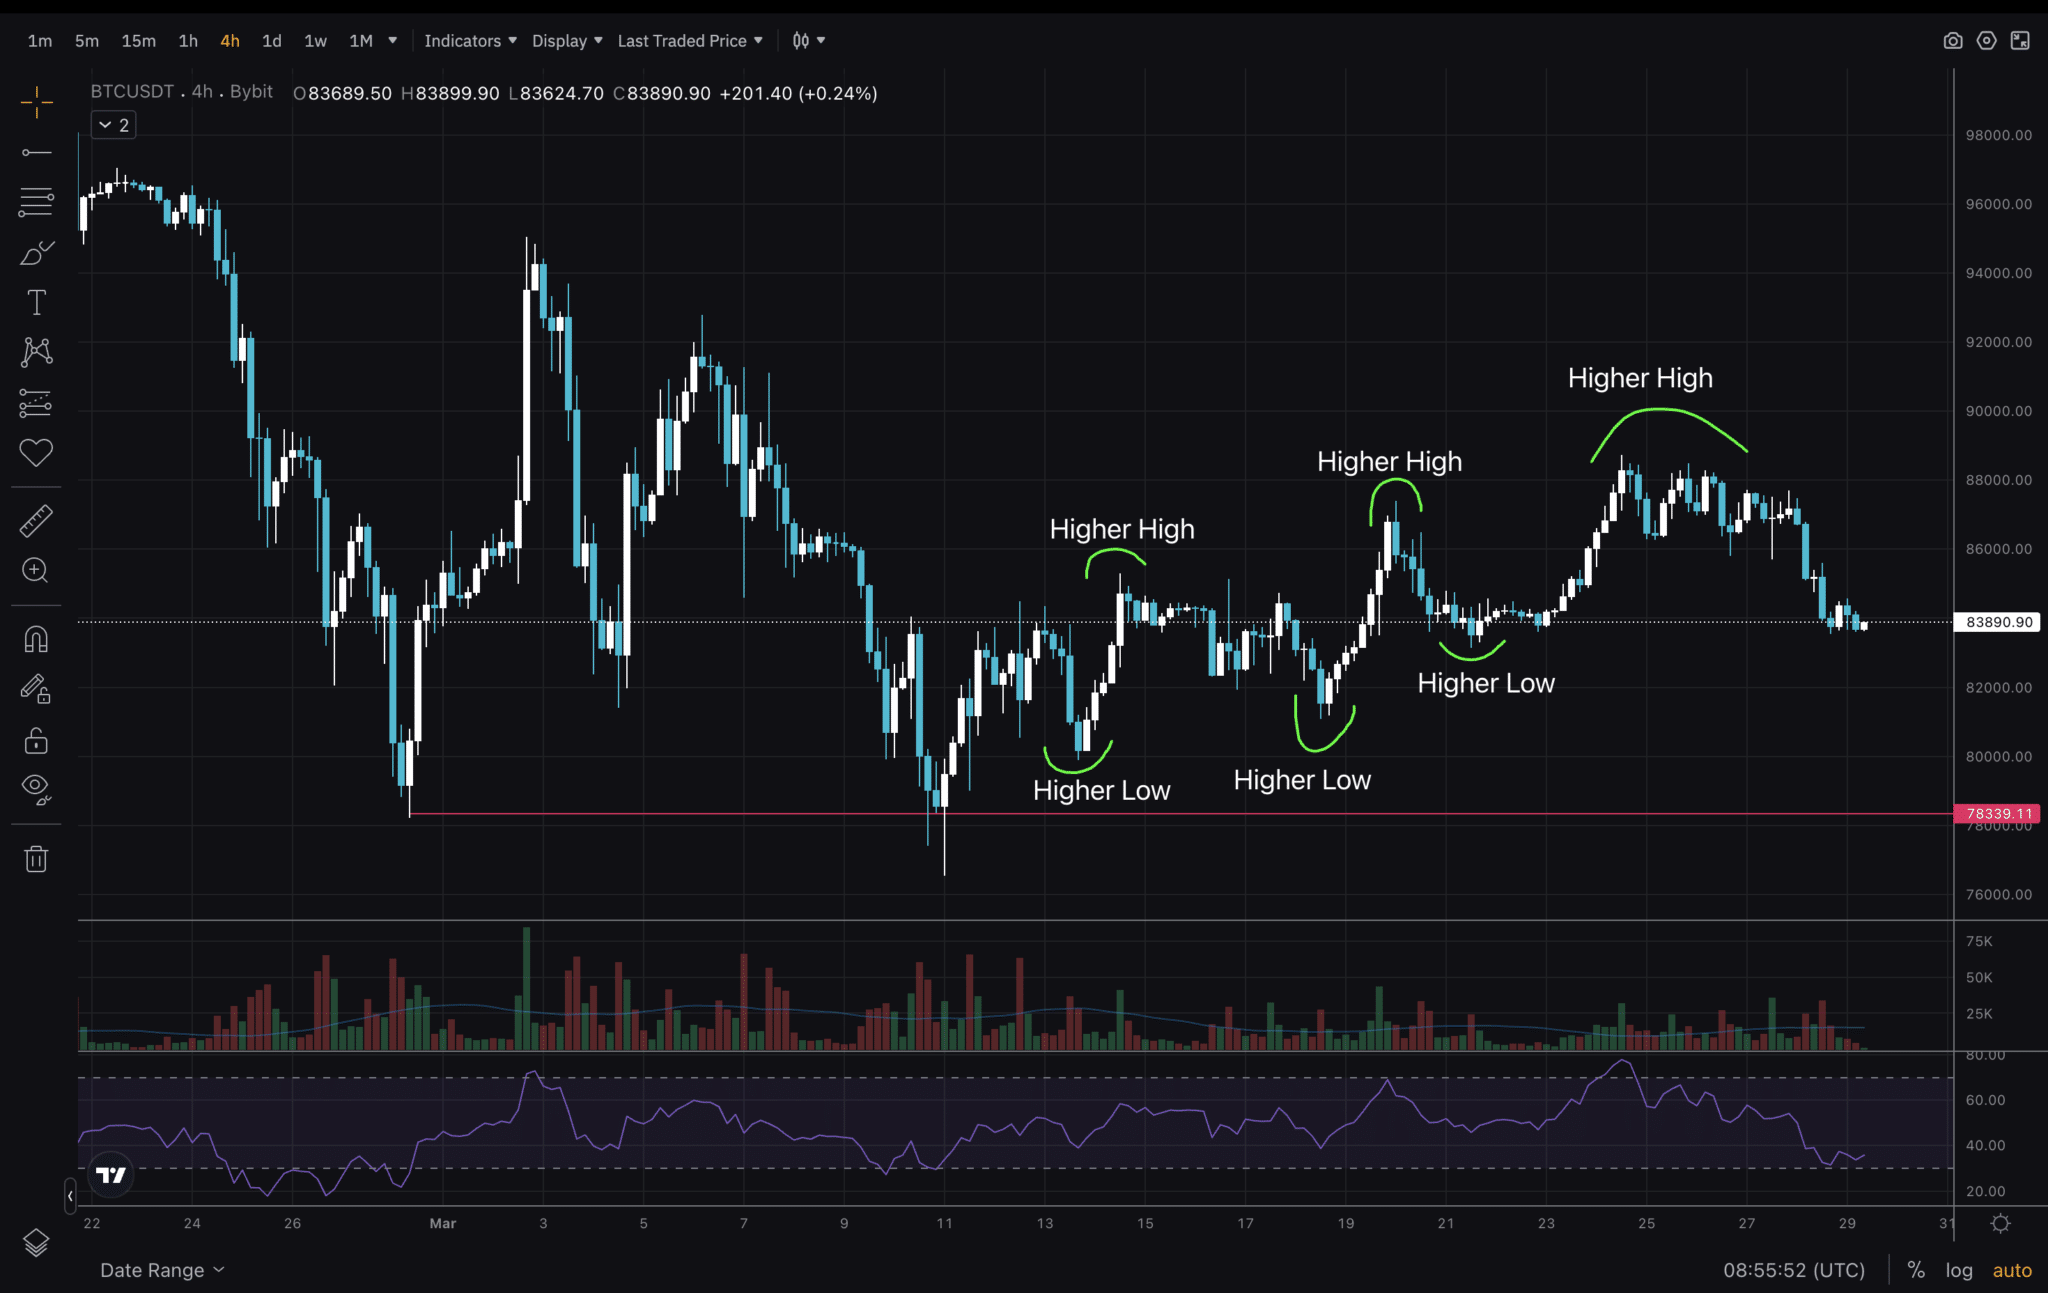
Bitcoin technical analysis continues the cryptocurrency market trend – upwards. We are looking the 4H timeframe and the BTC price volatility has printed one of investors favourite Bitcoin chart patterns. Namely, higher highs and higher lows. What we are seeing now is normal – a retrace to test one of the previous lows. And we really don’t want price to go below $78,000.
DISCOVER: Top 20 Crypto to Buy in March 2025
(BTCUSDT)
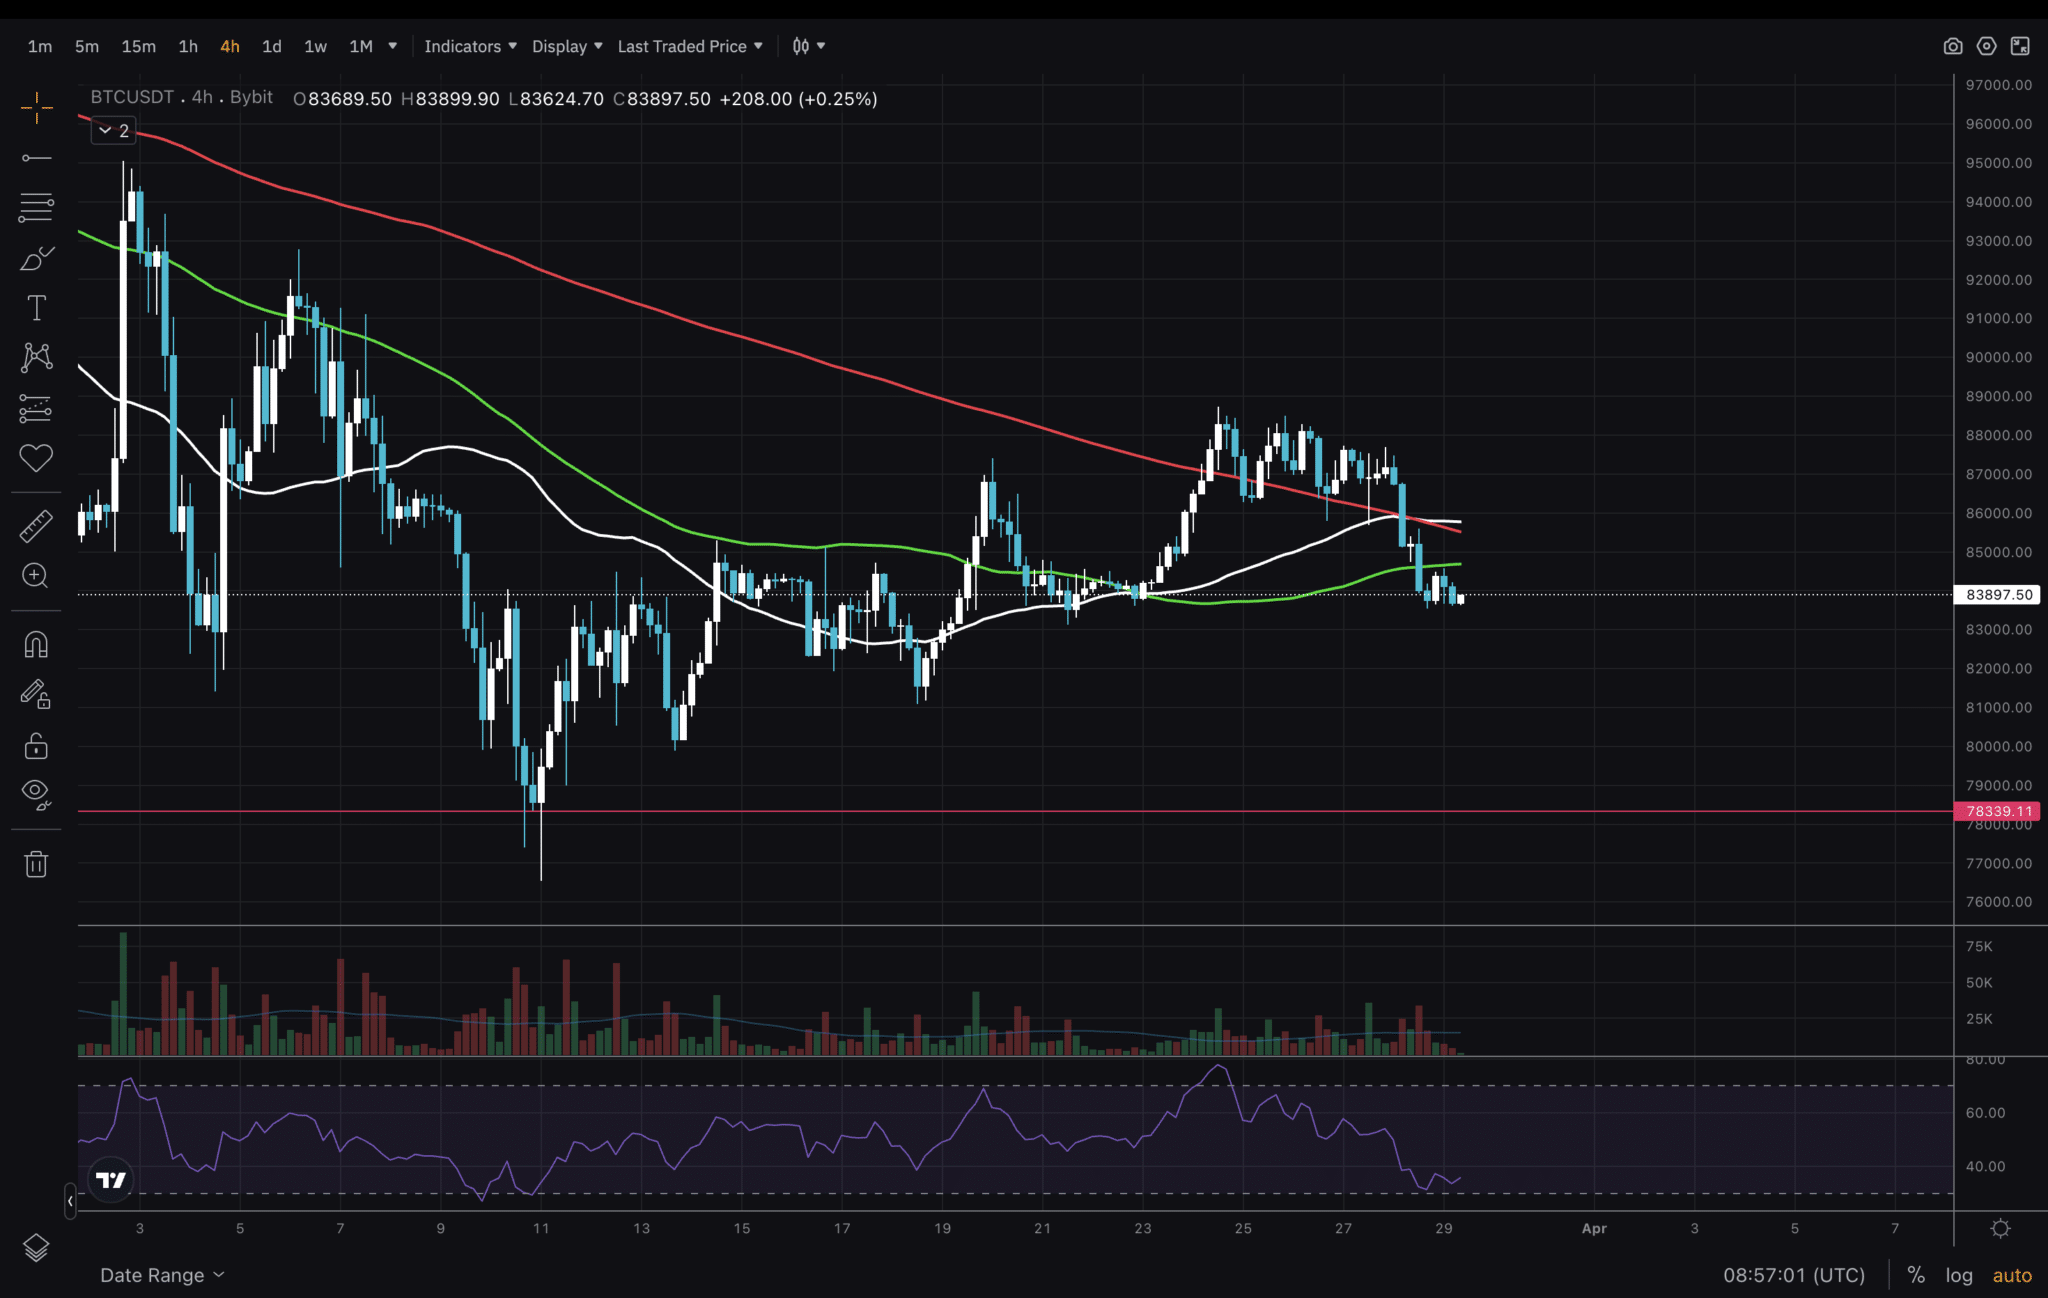
Staying on the 4H timeframe, I want us to give a quick glance at RSI and the Moving averages as well since these provide crypto trading signals. Price is hovering around the 50, 100 and 200 MAs and RSI has dropped to the level it was when we saw a dip below $78,000. This would suggest that we can expect a reversal to the upside sometime in the next few days. Ideally, we would continue ranging and hop above and below the MAs in order to form a bottom.
DISCOVER: Best New Cryptocurrencies to Invest in 2025
(BTCUSDT)
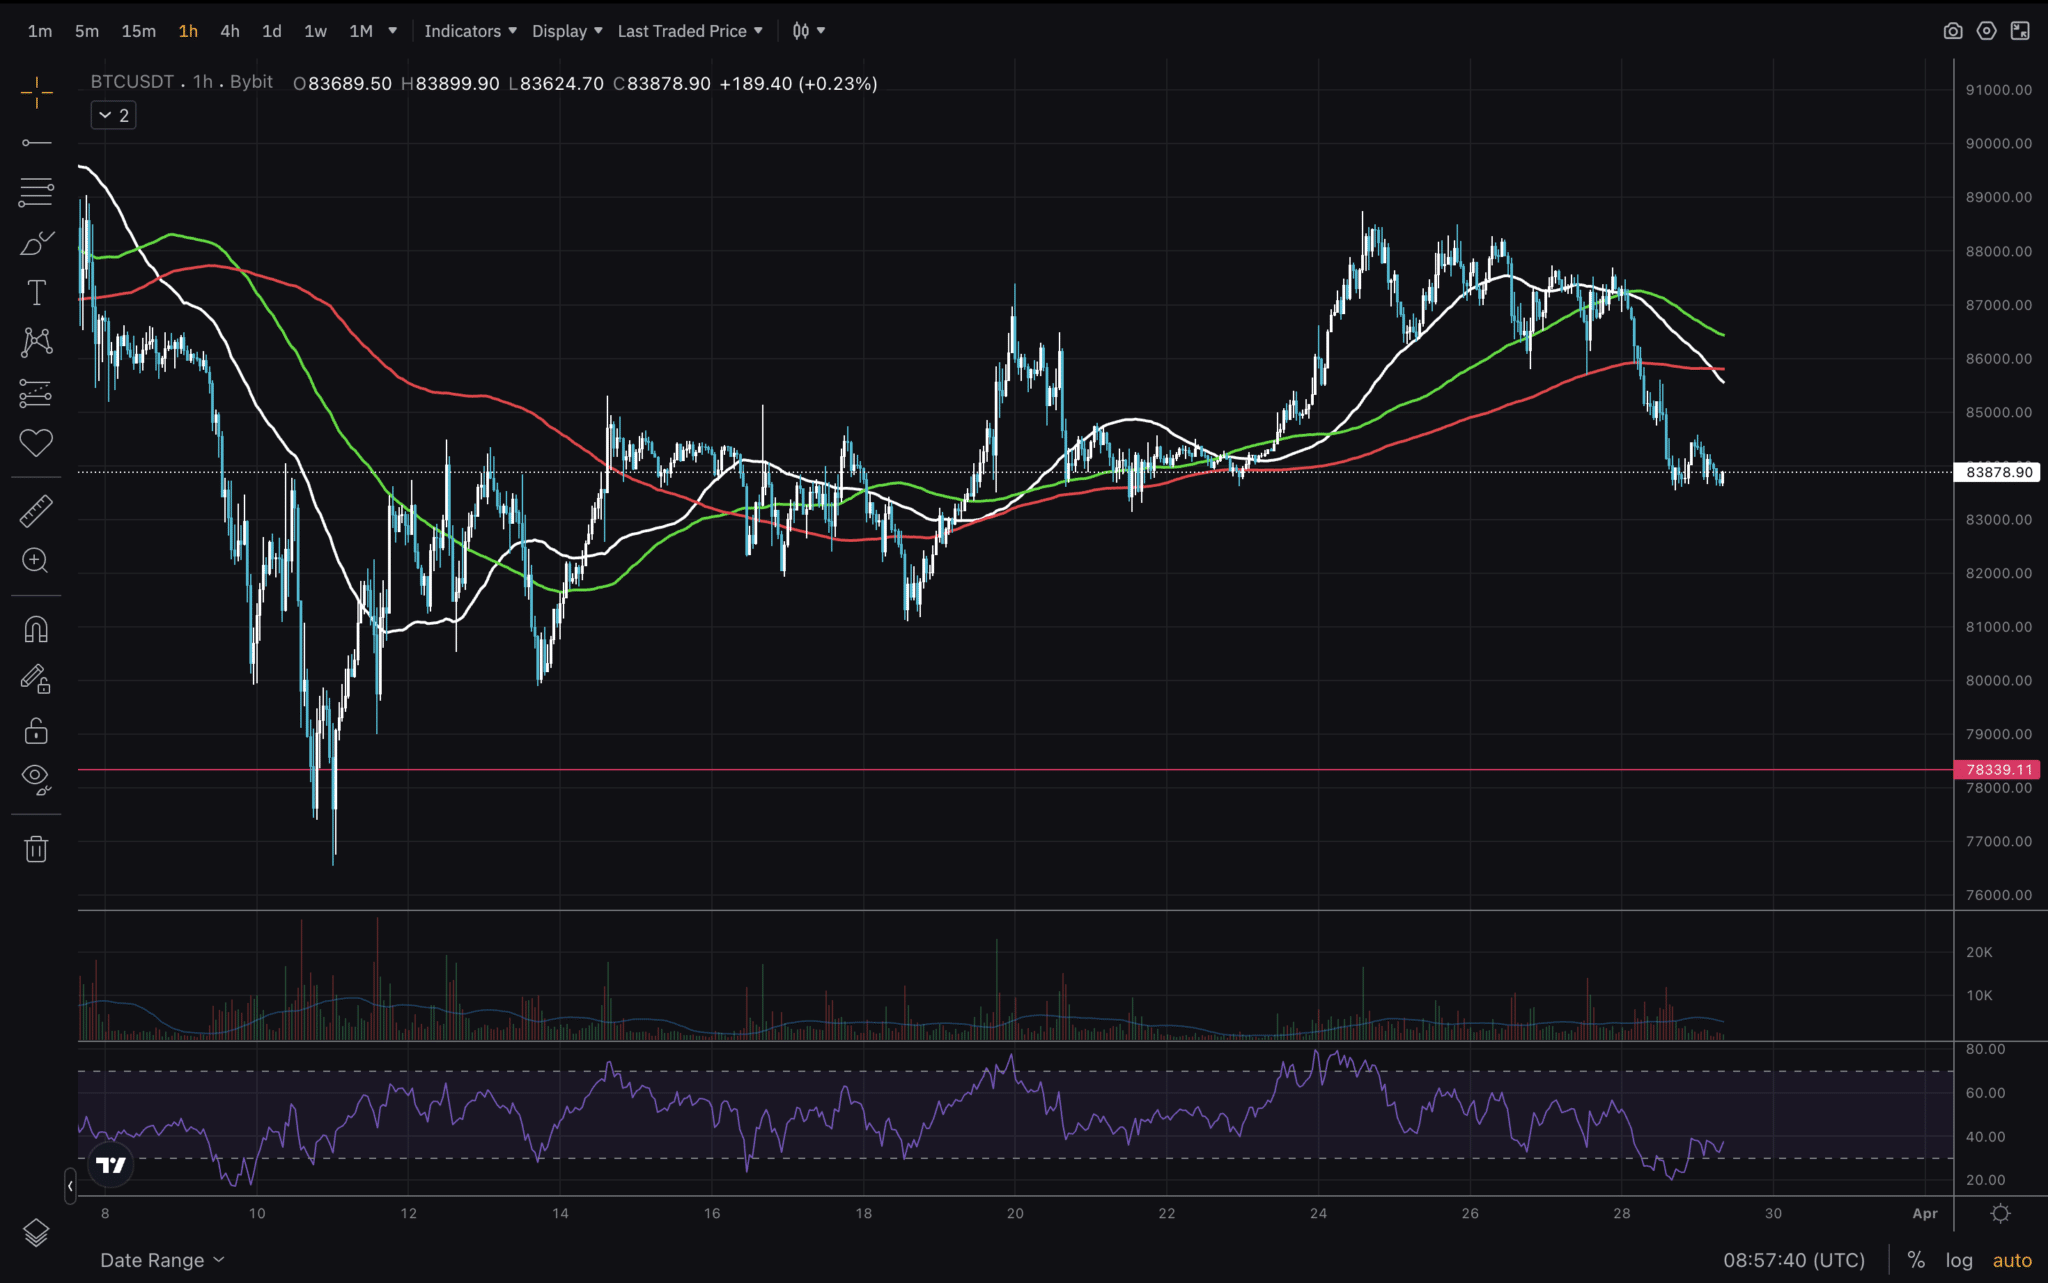
Last, we will explore the 1H timeframe. A low timeframe that could give us early crypto trading signals. That is because the Bitcoin chart patterns are still valid and there is enough BTC price volatility to decode. Price has broken below all the MAs on this timeframe as well and RSI looks bottomed. Actually there is a bullish divergence visible on the RSI chart. Being at a previous low level, this could be a good place for price to bounce off of. Keep a close eye on how price reacts when it reaches previous lows and trade with good risk management.
That’s all for today. Stay safe out there!
Join The 99Bitcoins News Discord Here For The Latest Market Updates
Bitcoin Price Action: Technical Insights from Recent Trends
- BTC price hovering around 4H and 1H MAs
- RSI bullish divergence on 1H
- We want to see price stay around current levels for a bottom to form
The post Bitcoin Price Action: Technical Insights from Recent Trends appeared first on 99Bitcoins.